Maria Shepherd, President and Founder, Medi-Vantage03.04.21
According to recently published data,1 supply costs (including medical devices) are one of the greatest expenses for healthcare facilities, after labor and administrative expenses. In total, supply budgets equal approximately 25-33 percent of the medical and surgical operating expenses at U.S. hospitals.
According to a 2018 clinical journal article, U.S. hospitals spent approximately $200 billion on medical devices.2 This figure represents 6 percent of the total U.S. healthcare spend of $3.81 trillion estimated by CMS for 2019.3 These are medical device costs in 2018—pre-COVID-19 figures. These medical costs include the cost of medical and implantable devices, and exclude pharmaceuticals used for patient care.
A large segment of this annual spend is utilized in hip and knee arthroplasties. In the past, hip and knee implants were commonly known as physician preference items (PPIs), selected by the physician’s choice of implant and brand. In many cases, hospitals doing high volumes of hip and knee arthroplasties used multiple brands, and little effort was made to standardize these purchases.
Why This Is Important
Hospital medical and supply costs are affected by external and internal forces. External forces range from a force majeure, such as the pandemic, to corporate decisions, as in pharmaceutical pricing. Internal cost pressures can be caused by physician preference items.4 For example, in 2007, orthopedic surgeons, even though employed by hospitals, had a higher level of physician preference items (PPI) used in surgery. In a study, 61 percent of orthopedic products were physician preference items.5 Compare that to data published in 2015, where the supply chain spend on PPI was estimated to be approximately 40 percent.1
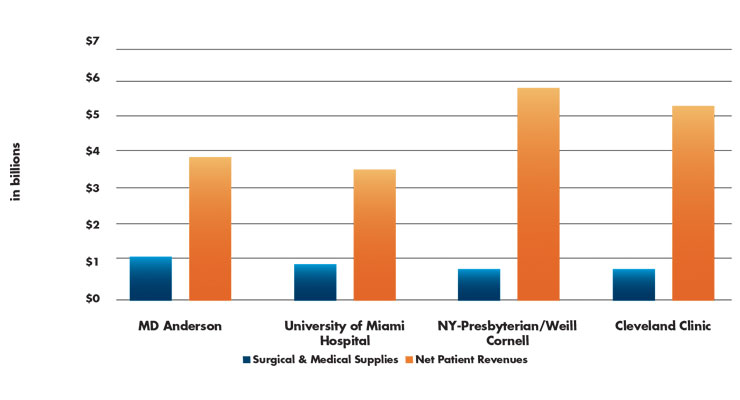
What hip and knee implant and vendor characteristics, as evaluated by orthopedic surgeons, are associated with their preference? What other factors (e.g., financial relationships or vendor tenure) may contribute to implant preference? Although PPI spending and supply costs are discretionary hospital expenses, and many hospitals seek to reduce that percentage, supply chain spending has been increasing since 2014 (Table 1).

Table 1: 2018 Medical and Surgical Supply Costs vs. Net Patient Revenue by Institution1
It is estimated that from 2014 to 2018, medical and surgical supply costs grew by a 7 percent CAGR in U.S. hospitals. In comparison, total hospital supply costs rose by an estimated 6 percent CAGR during the same period. This is big money, and it is good news for the medical products industry. In 2018, medical and surgical supply costs were calculated at $27.4 million on average per hospital. If the same growth continues, the total by 2025 will rise to $44 million annually per healthcare facility.
Bed Count Relevance
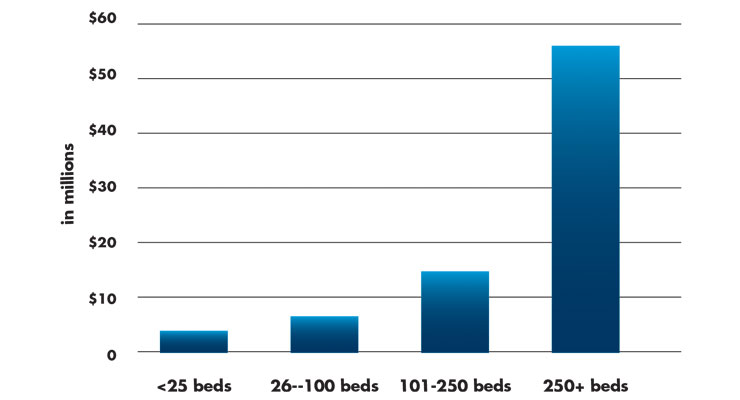
In the same database, medical and surgical supply costs increased substantially with bed counts. In 2018, small hospitals (25 beds or fewer) were reported to spend approximately $2.24 million on medical and surgical supplies. Hospitals with 250 beds spent an average of $56 million on medical and surgical supply costs—an enormous leap in spending by any measure (Table 2).

Table 2: Average Medical and Surgical Supply Spend by Hospital Bed Count1
The Shifting Supply Chain
Growth in the U.S. ambulatory surgery center (ASC) market is a result of increased focus on reduction of healthcare costs and diverted healthcare spending to ASCs. An increasing number of procedures provided by ASCs are seeing increased reimbursement from CMS.
Development of a new ASC requires significant capital investment to build new facilities or upgrade existing ones to remain competitive.6 The change in the number of ASCs is an indicator of the willingness of the financial community to meet the needs of an ASC’s ability to raise capital. The number of ASCs grew significantly over the past decade, from 5,253 in 2013 to 5,717 in 2018.
Prior to 2014, Medicare payments accounted for only 20 percent of the average ASC’s overall revenue. From 2015 through 2017, hospitals, insurers, and private equity significantly increased acquisitions of and investments in businesses that own and operate ASCs. These investments are expected to pay off based on the reimbursement changes that went into effect on Jan. 1, 2021.7 On Dec. 2, 2020, CMS finalized policies directed by President Donald Trump’s Executive Order, “Protecting and Improving Medicare for Our Nation’s Seniors.” The purported benefit of the Executive Order was to lower patients’ out-of-pocket costs, empower patients by increasing choice, and protect taxpayer dollars.
Consistent with previous years, almost 95 percent of ASCs in 2018 were for-profit with 93 percent located in urban areas. This does not correlate with the estimated 78.5 percent of hospital outpatient departments that are reported in urban areas.6 Clearly, ASC managers are targeting locations where the majority of patients are located.
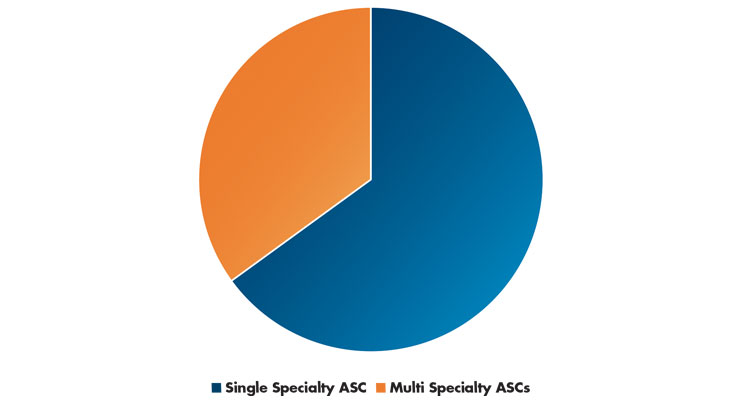
In 2018, most ASCs that billed CMS specialized in a single clinical area. Gastroenterology and ophthalmology (both 21 percent of ASCs) were the most frequently reported. Also, in 2018, 65 percent of ASCs were single-specialty and 35 percent were multispecialty (providing services in more than one clinical specialty; Table 3).6

Table 3: ASC Specialty Centers Versus Multispecialty Centers6
The Medi-Vantage Perspective
The shift from hospitals to ASCs will have a substantial impact on the U.S. medical device market. While most ASCs adhere to high-quality standards, many ASCs in our research are late adopters and purchase re-furbished capital equipment to manage the lower reimbursements they are getting for commonly performed procedures. This doesn’t mean a medical device strategy targeting ASCs will be unsuccessful. Our research shows greater than 50 percent of all procedures will be performed in an ASC or outpatient environment, so the procedure rates are there. The products to be developed for a lower reimbursement environment, however, must have carefully selected marketing requirements to be sure they meet the price-sensitivity of ASCs and outpatient departments. It is this added set of unmet needs that will make your ASC-targeted device robust and successful.
References
Maria Shepherd has more than 20 years of leadership experience in medical device/life-science marketing in small startups and top-tier companies. After her industry career, including her role as vice president of marketing for Oridion Medical where she boosted the company valuation prior to its acquisition by Medtronic, director of marketing for Philips Medical, and senior management roles at Boston Scientific Corp., she founded Medi-Vantage. Medi-Vantage provides marketing and business strategy and innovation research for the medical device industry. The firm quantitatively and qualitatively sizes and segments opportunities, evaluates new technologies, provides marketing services, and assesses prospective acquisitions. Shepherd has taught marketing and product development courses, speaks regularly at medtech conferences, and can be reached at mshepherd@medi-vantage.com. Visit her website at www.medi-vantage.com.
According to a 2018 clinical journal article, U.S. hospitals spent approximately $200 billion on medical devices.2 This figure represents 6 percent of the total U.S. healthcare spend of $3.81 trillion estimated by CMS for 2019.3 These are medical device costs in 2018—pre-COVID-19 figures. These medical costs include the cost of medical and implantable devices, and exclude pharmaceuticals used for patient care.
A large segment of this annual spend is utilized in hip and knee arthroplasties. In the past, hip and knee implants were commonly known as physician preference items (PPIs), selected by the physician’s choice of implant and brand. In many cases, hospitals doing high volumes of hip and knee arthroplasties used multiple brands, and little effort was made to standardize these purchases.
Why This Is Important
Hospital medical and supply costs are affected by external and internal forces. External forces range from a force majeure, such as the pandemic, to corporate decisions, as in pharmaceutical pricing. Internal cost pressures can be caused by physician preference items.4 For example, in 2007, orthopedic surgeons, even though employed by hospitals, had a higher level of physician preference items (PPI) used in surgery. In a study, 61 percent of orthopedic products were physician preference items.5 Compare that to data published in 2015, where the supply chain spend on PPI was estimated to be approximately 40 percent.1
What hip and knee implant and vendor characteristics, as evaluated by orthopedic surgeons, are associated with their preference? What other factors (e.g., financial relationships or vendor tenure) may contribute to implant preference? Although PPI spending and supply costs are discretionary hospital expenses, and many hospitals seek to reduce that percentage, supply chain spending has been increasing since 2014 (Table 1).

Table 1: 2018 Medical and Surgical Supply Costs vs. Net Patient Revenue by Institution1
It is estimated that from 2014 to 2018, medical and surgical supply costs grew by a 7 percent CAGR in U.S. hospitals. In comparison, total hospital supply costs rose by an estimated 6 percent CAGR during the same period. This is big money, and it is good news for the medical products industry. In 2018, medical and surgical supply costs were calculated at $27.4 million on average per hospital. If the same growth continues, the total by 2025 will rise to $44 million annually per healthcare facility.
Bed Count Relevance
In the same database, medical and surgical supply costs increased substantially with bed counts. In 2018, small hospitals (25 beds or fewer) were reported to spend approximately $2.24 million on medical and surgical supplies. Hospitals with 250 beds spent an average of $56 million on medical and surgical supply costs—an enormous leap in spending by any measure (Table 2).

Table 2: Average Medical and Surgical Supply Spend by Hospital Bed Count1
The Shifting Supply Chain
Growth in the U.S. ambulatory surgery center (ASC) market is a result of increased focus on reduction of healthcare costs and diverted healthcare spending to ASCs. An increasing number of procedures provided by ASCs are seeing increased reimbursement from CMS.
Development of a new ASC requires significant capital investment to build new facilities or upgrade existing ones to remain competitive.6 The change in the number of ASCs is an indicator of the willingness of the financial community to meet the needs of an ASC’s ability to raise capital. The number of ASCs grew significantly over the past decade, from 5,253 in 2013 to 5,717 in 2018.
Prior to 2014, Medicare payments accounted for only 20 percent of the average ASC’s overall revenue. From 2015 through 2017, hospitals, insurers, and private equity significantly increased acquisitions of and investments in businesses that own and operate ASCs. These investments are expected to pay off based on the reimbursement changes that went into effect on Jan. 1, 2021.7 On Dec. 2, 2020, CMS finalized policies directed by President Donald Trump’s Executive Order, “Protecting and Improving Medicare for Our Nation’s Seniors.” The purported benefit of the Executive Order was to lower patients’ out-of-pocket costs, empower patients by increasing choice, and protect taxpayer dollars.
Consistent with previous years, almost 95 percent of ASCs in 2018 were for-profit with 93 percent located in urban areas. This does not correlate with the estimated 78.5 percent of hospital outpatient departments that are reported in urban areas.6 Clearly, ASC managers are targeting locations where the majority of patients are located.
In 2018, most ASCs that billed CMS specialized in a single clinical area. Gastroenterology and ophthalmology (both 21 percent of ASCs) were the most frequently reported. Also, in 2018, 65 percent of ASCs were single-specialty and 35 percent were multispecialty (providing services in more than one clinical specialty; Table 3).6

Table 3: ASC Specialty Centers Versus Multispecialty Centers6
The Medi-Vantage Perspective
The shift from hospitals to ASCs will have a substantial impact on the U.S. medical device market. While most ASCs adhere to high-quality standards, many ASCs in our research are late adopters and purchase re-furbished capital equipment to manage the lower reimbursements they are getting for commonly performed procedures. This doesn’t mean a medical device strategy targeting ASCs will be unsuccessful. Our research shows greater than 50 percent of all procedures will be performed in an ASC or outpatient environment, so the procedure rates are there. The products to be developed for a lower reimbursement environment, however, must have carefully selected marketing requirements to be sure they meet the price-sensitivity of ASCs and outpatient departments. It is this added set of unmet needs that will make your ASC-targeted device robust and successful.
References
- bit.ly/mpo210301
- bit.ly/mpo210302
- bit.ly/mpo210303
- bit.ly/mpo210304
- bit.ly/mpo210305
- bit.ly/mpo210306
- bit.ly/mpo210307
Maria Shepherd has more than 20 years of leadership experience in medical device/life-science marketing in small startups and top-tier companies. After her industry career, including her role as vice president of marketing for Oridion Medical where she boosted the company valuation prior to its acquisition by Medtronic, director of marketing for Philips Medical, and senior management roles at Boston Scientific Corp., she founded Medi-Vantage. Medi-Vantage provides marketing and business strategy and innovation research for the medical device industry. The firm quantitatively and qualitatively sizes and segments opportunities, evaluates new technologies, provides marketing services, and assesses prospective acquisitions. Shepherd has taught marketing and product development courses, speaks regularly at medtech conferences, and can be reached at mshepherd@medi-vantage.com. Visit her website at www.medi-vantage.com.


