Maria Shepherd, President and Founder, Medi-Vantage05.02.22
Somehow, the cost of operating in the OR never seems to decline. Regardless of how much the medical device industry and our colleagues in hospital management try to expand value, improvements in quality seem to escalate costs. In every budgetary impact model we create at Medi-Vantage, we develop estimates for the cost of one minute of cath lab, ambulatory surgery center, ICU, or operating room (OR) time and the costs we calculate vary dramatically. There are a great number of variables. The mean cost of one minute of hospital time can be stratified by setting (inpatient vs. ambulatory vs. cath lab vs. ICU), academic vs. community hospitals, and, unique to the United States (U.S.), by for-profit vs. not-for-profit hospital ownership. The proportion of cost attributable to variable and fixed costs also differs by location. Fixed costs are usually divided into salary, benefits, supplies, capital equipment, and other direct expenses.
Let’s be sure to properly identify the nomenclature. Hospitals (leaving out ambulatory surgery centers for a moment) can be segmented into three financial categories. The first—for profit, fully private hospitals—are a business, answering to investors and shareholders. The second—public hospitals—are owned by state or local governments and have obligations to care for underserved populations. Third are nonprofit hospitals, including some of the most prestigious in the U.S., such as Mass General Brigham, Cleveland Clinic, and the Mayo Clinic. The nonprofit part means they are exempt from federal and local taxes in return for providing “community benefit” such as free or subsidized care for people with incomes below certain levels, public health investments, and community-based programs to focus on the social determinants of health, such as housing or food insecurity.
There are many peer-reviewed journal articles regarding cost-savings in surgery, but there is little consensus on the amount of savings and the variables that come into play. Nowhere is this more clear than the OR. Multiple per minute estimates exist from <$10/minute to >$100/minute.
Estimates place surgical care at almost 30 percent of all U.S. healthcare spending.4 In California, hospitals are required to report financial metrics; a study used these metrics (collected in 2013) to calculate the average cost of one minute of OR time by the Office of Statewide Health Planning and Development (OSHPD).1 To provide more granular detail, in fiscal year 2014, a total of 175 of 302 facilities in California were not-for-profit, 78 were for-profit, and 49 were nonprofit. Also, 30 facilities were academic (Table 1). This is important. Cost estimates for OR time are expected to vary dramatically in for-profit, not-for-profit, nonprofit, and academic institutions. Although these data were collected from 2014 sources, these estimates are still expected to be valid today.
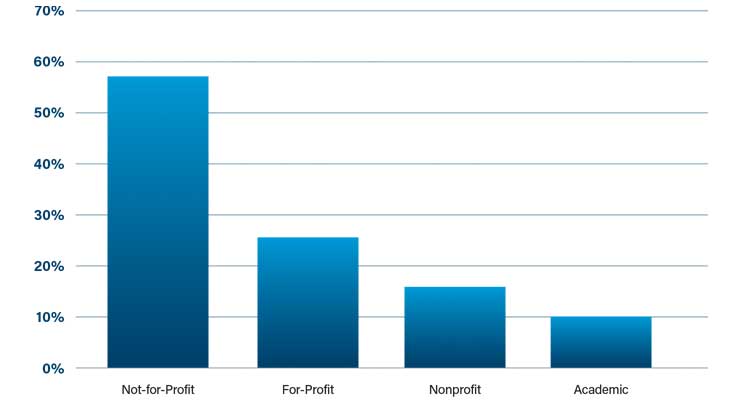
Table 1: Percentage of hospital types in California (FY2014)1
The depth of this data is remarkable. It covers the range of costs of one minute of OR time across all California hospitals. The mean cost of the inpatient setting (expected to have the highest acuity patients), as compared to the ambulatory setting were unexpectedly close—$37.45, ±$16.04 and $36.14, ±$19.53 (P=0.65), respectively (Table 2).1 Why are the costs of care so close when it is postulated the sickest go to hospitals and the fittest patients are cherry picked for ambulatory surgery centers?

Table 2: Cost of One Minute of OR Time by Setting (P=0.65)1
There were no differences seen in average costs when analyzing by profit status or academic status except academic hospitals had lower average expenditures than nonteaching hospitals in the inpatient setting.
The authors stated that between fiscal years 2005 to 2014, OR costs grew rapidly.¹ In this analysis, the average cost of operating room time in fiscal year 2014 for acute care hospitals in California was $36 to $37 per minute. Direct cost was $20 to $21, with $13 to $14 portioned to wages and benefits and $2.50 to $3.50 attributable to surgical supplies (Table 3).1

Table 3: Cost of OR Time in FY2014 in California Hospitals1
Other studies of the cost per minute have been based in single-site studies with a great deal of variability and estimates as low as $6.67/minute and as high as $113/minute. None had the broad reach of the 445 California facilities used to calculate the data using precise accounting standards directed by the OSHPD.
The authors want to know, “What does one minute of saved OR time mean to the hospital?”1 In our hospital administrator economic buyer research, we’ve had many of those hospital administrator respondents tell us saving OR time is a soft cost savings and has to be clinically validated for them to calculate into their algorithms for the value-analysis committee. At $37 per minute, OR time calculates to greater than $2,200/hour. In this study, almost 50 percent of this cost is indirect—produced by nonrevenue centers and usually assigned based on accounting policies, such as square footage, which is beyond the influence of surgeons and administrative staff (i.e., OR managers).
Also noted was of the direct costs of $20 to $21, greater than two-thirds ($13 to $14) is allocated to salaries and benefits, which include OR staff (i.e., surgeons, circulating and scrub nurses, physician’s assistants) and hospital administrators. For medical devices that save OR time, which hospital employees are affected? The authors cite studies about wound closure that show no difference between wound closure time and total procedure time because of the need for the staff to stay with the patient until they leave the OR.1
References
Maria Shepherd has more than 20 years of leadership experience in medical device/life-science marketing in small startups and top-tier companies. She can be reached at mshepherd@medi-vantage.com. Visit her website at www.medi-vantage.com.
Let’s be sure to properly identify the nomenclature. Hospitals (leaving out ambulatory surgery centers for a moment) can be segmented into three financial categories. The first—for profit, fully private hospitals—are a business, answering to investors and shareholders. The second—public hospitals—are owned by state or local governments and have obligations to care for underserved populations. Third are nonprofit hospitals, including some of the most prestigious in the U.S., such as Mass General Brigham, Cleveland Clinic, and the Mayo Clinic. The nonprofit part means they are exempt from federal and local taxes in return for providing “community benefit” such as free or subsidized care for people with incomes below certain levels, public health investments, and community-based programs to focus on the social determinants of health, such as housing or food insecurity.
Why This Is Important
Want value-based care? Start with a deep understanding of the costs of hospital care. According to a JAMA article, most healthcare institutions charge insurers and patients at a markup, with a goal to have revenue exceed costs to produce a profit.1 Even nonprofit hospitals need to show a nominal profit. Nonprofit hospitals had a median operating margin of 0.5 percent in fiscal year (FY) 2020, down from 2.4 percent in FY 2019, and an operating flow margin of 6.7 percent, down from 8.4 percent in FY 2019.2,3There are many peer-reviewed journal articles regarding cost-savings in surgery, but there is little consensus on the amount of savings and the variables that come into play. Nowhere is this more clear than the OR. Multiple per minute estimates exist from <$10/minute to >$100/minute.
Estimates place surgical care at almost 30 percent of all U.S. healthcare spending.4 In California, hospitals are required to report financial metrics; a study used these metrics (collected in 2013) to calculate the average cost of one minute of OR time by the Office of Statewide Health Planning and Development (OSHPD).1 To provide more granular detail, in fiscal year 2014, a total of 175 of 302 facilities in California were not-for-profit, 78 were for-profit, and 49 were nonprofit. Also, 30 facilities were academic (Table 1). This is important. Cost estimates for OR time are expected to vary dramatically in for-profit, not-for-profit, nonprofit, and academic institutions. Although these data were collected from 2014 sources, these estimates are still expected to be valid today.
Table 1: Percentage of hospital types in California (FY2014)1
The depth of this data is remarkable. It covers the range of costs of one minute of OR time across all California hospitals. The mean cost of the inpatient setting (expected to have the highest acuity patients), as compared to the ambulatory setting were unexpectedly close—$37.45, ±$16.04 and $36.14, ±$19.53 (P=0.65), respectively (Table 2).1 Why are the costs of care so close when it is postulated the sickest go to hospitals and the fittest patients are cherry picked for ambulatory surgery centers?
Table 2: Cost of One Minute of OR Time by Setting (P=0.65)1
There were no differences seen in average costs when analyzing by profit status or academic status except academic hospitals had lower average expenditures than nonteaching hospitals in the inpatient setting.
The authors stated that between fiscal years 2005 to 2014, OR costs grew rapidly.¹ In this analysis, the average cost of operating room time in fiscal year 2014 for acute care hospitals in California was $36 to $37 per minute. Direct cost was $20 to $21, with $13 to $14 portioned to wages and benefits and $2.50 to $3.50 attributable to surgical supplies (Table 3).1
Table 3: Cost of OR Time in FY2014 in California Hospitals1
Other studies of the cost per minute have been based in single-site studies with a great deal of variability and estimates as low as $6.67/minute and as high as $113/minute. None had the broad reach of the 445 California facilities used to calculate the data using precise accounting standards directed by the OSHPD.
The authors want to know, “What does one minute of saved OR time mean to the hospital?”1 In our hospital administrator economic buyer research, we’ve had many of those hospital administrator respondents tell us saving OR time is a soft cost savings and has to be clinically validated for them to calculate into their algorithms for the value-analysis committee. At $37 per minute, OR time calculates to greater than $2,200/hour. In this study, almost 50 percent of this cost is indirect—produced by nonrevenue centers and usually assigned based on accounting policies, such as square footage, which is beyond the influence of surgeons and administrative staff (i.e., OR managers).
Also noted was of the direct costs of $20 to $21, greater than two-thirds ($13 to $14) is allocated to salaries and benefits, which include OR staff (i.e., surgeons, circulating and scrub nurses, physician’s assistants) and hospital administrators. For medical devices that save OR time, which hospital employees are affected? The authors cite studies about wound closure that show no difference between wound closure time and total procedure time because of the need for the staff to stay with the patient until they leave the OR.1
The Medi-Vantage Perspective
The authors note costs per minute were stable, with little change between hospital types and profit status. They explained this may be due to “optimized efficiency with little room for improvement.”1 For all of us who have watched cases in the OR—interventional suite or ambulatory surgery center—we know this isn’t true. This is not to criticize the work of the authors, who have gone a long way toward improving our understanding of the cost of procedures and helping us to better understand those costs. But, as we all know, there are an abundance of opportunities to advance efficiency, cost, and patient outcomes to better improve the performance of medical devices and surgical tools.References
Maria Shepherd has more than 20 years of leadership experience in medical device/life-science marketing in small startups and top-tier companies. She can be reached at mshepherd@medi-vantage.com. Visit her website at www.medi-vantage.com.
