Scott Phillips, CEO, StarFish Medical03.04.20
Many medical device companies we’ve worked with over the last 20 years have experienced significant outcomes. The founders did well in some cases, and in others, not so well. I wondered whether there was some predictable pattern to the outcomes. Could we act to help founders do better? Would optimizing valuation at seed and A rounds minimize founder dilution for better outcomes? On the surface it seems obvious, but is there data to support my hypothesis?
Looking at public markets can provide access to data. I found publicly available data on 24 medical device companies that had gone public (assembled by H. Lebret). As part of the listing process they disclosed details of all their prior funding events. Admittedly, there’s a selection bias with choosing startups that chose the public listing route, but the data is consistent and has been well scrutinized. Imperfections in data interpretation are my own (I’m an engineer after all), but I believe the conclusions hold true.
One story from the data is Cambridge Heart, founded based on research by Dr. Richard Cohen and an early cardiac electrophysiology innovator. MIT had spent a lot of money on securing patents for him and threatened to cut off IP funding unless he commercialized his inventions. He convinced MIT alumnus Jeffrey Arnold to be founding CEO and the company was born. Per publicly available information from the later IPO, Dr. Cohen received 1.25 million founders shares and a smaller number of options. A couple of other co-founders and MIT split another million shares.
In the A round of financing, 6.6 million shares were sold at $1 each, giving the company $6.6M to work with. (Interestingly, none of this came from venture capitalists.) When converted to commons they became 3.3 million common shares, so Dr. Cohen’s stake was down to 23 percent. In the B round two years later, another $3.5M was raised in exchange for 1.2M shares, after conversion. Before the company went public, he still owned 14.5 percent of the shares. In all, the company raised only $10.1M. The post IPO value was $167M—a ratio of almost 17x, which certainly helped overcome the equity dilution the founders had to take. Dr. Cohen’s stake was worth $17.7M. Other employees and directors shared $23.1M. It was a very successful outcome for the early visionaries and risk takers.
Intuitive Surgical, an innovator in robotic endoscopic surgery to allow minimally invasive procedures, is another interesting example. There were four co-founders: Frederic Moll, Robert Younge, John Freund, and the Stanford Research Institute. Similar to the Cambridge Heart case, they later hired another person, Lonnie Smith, as CEO.
Over three and a half years, the company completed four financing rounds. The first raised $5.4M on a $3.4M valuation—a 62 percent dilution event. They made incredibly efficient use of this capital. A year later they raised $30M at a $44M pre-money valuation for $5 per share. The share price had quintupled in that year. Later that year, they raised $17M at a $119M value for $8 per share. The next round took almost a year to complete and was at the same share price. They raised $41M at a $136M valuation in May 1999. The company did its IPO in June of 2000 at a $301 million post-money valuation. Their timing was miraculous, as the tech crash of 2000 was just around the corner. The founders’ value at exit was $30.4M. It seems the capital efficiency they exhibited with their first round had a dramatic effect in lowering their equity dilution and allowing them to create value.
The $300M IPO value was a relatively modest 3x more than the $93M raised in those four rounds. Today the company is valued at $70 billion, so it’s gone up over 200x in value from its IPO. Hopefully some of those investors held onto their shares.
In contrast, consider Inogen, an oxygen concentrator company that went public in 2013. The founders—Alison Bauerlein, Brenton Taylor, and Byron Myers—were students at UC Santa Barbara and won a business plan competition in 2001 for a new type of oxygen concentrator. They diluted 75 percent in their first round to raise $250,000. That’s what happens to students without a track record. From there, they did incredibly well, raising rounds of $5M, $6.6M, and $35.6M at increasing valuations. Then came two down rounds around the time of the 2008 crash. The second was at a lower share price than the original seed round.
Inogen was lucky to have survived; many companies weren’t so lucky. They brought in a hired gun CEO who received 2.5x as much equity as the founders. Together, they were successful in navigating equity raising and executed a successful IPO. Out of a $418M IPO value, the founders shared $4M. There was an option pool as well, so hopefully they got a piece of that. They built a company with almost 350 employees over 13 years. Today it’s valued at almost $1B.
The public data set had founder outcomes from $1M to $120M and time to IPO from four to 16 years. I had various hypotheses about what would lead to better founder outcomes. Time would be the entrepreneur’s enemy and longer stories would lead to worse outcomes. Minimizing A-round dilution would drive wealth creation. Large raises and many rounds would work against founder value. I tested the various theories.
Some broad observations can be made. About half got $20M or more between the founders (Chart 1) and the balance of the companies made far less for their founders. These companies made it to IPO and are often representative of a strong company with a big story. (Second Sight, with a founder exit of $120M, is a special case since Alfred Mann used a lot of his own money from previous successes to build it.)
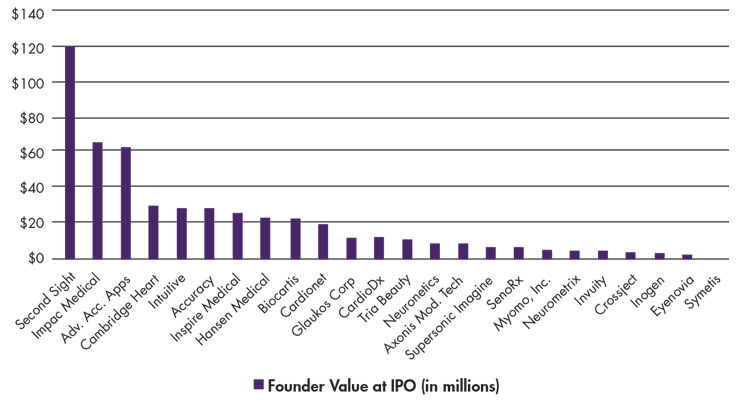
Chart 1: Companies and the outcomes the founders achieved.
Time to exit was weakly correlated with founder outcome. Four of the strongest founder outcomes, (Cambridge Heart, Intuitive Surgical, Hansen Medical, and Biocartis) happened in less than eight years. The average of the rest was over 12 years. Five of the top 10 exits took over ten years. Unfortunately, there’s nothing fast about developing a medical device company to the point where it’s ready for a public listing.
My best hypothesis was on A-round dilution (Chart 2). I was confident a bunch of early dilution was bad. The data is not so clear. The top three founder exits all had A-round dilutions of 45 percent or lower, but the average of the rest was 59 percent—very close to the average of the rest of the top 10. There was no obvious pattern and correlation is weak; there were a lot of great exits with high early dilution.
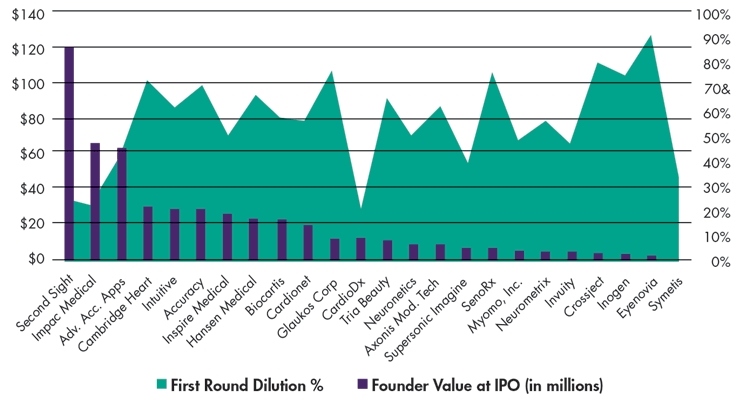
Chart 2: A-round dilution.
The size of company varied from $30M to $3B and there was no strong correlation. Similarly, the total amount of investment was poorly correlated.
One value had a strong correlation: exit multiple, or the ratio of IPO value to total investment (Chart 3). It averaged over 16x for the top 10 and was under 4x for the rest. The data isn’t perfect; it doesn’t capture non-share transactions such as founder initial investment. Nonetheless, this correlation is too strong to ignore.
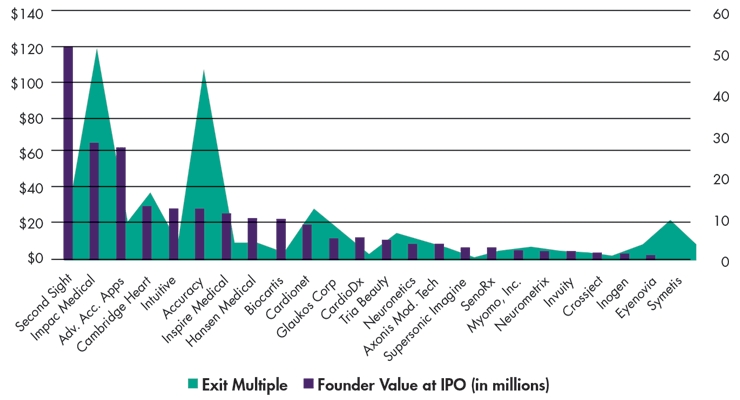
Chart 3: Ratio of IPO value to total investment.
I argue exit multiple is the most honest venture efficiency measure. In a simplistic way, it’s the ratio of the clinical value created vs. how expensive it was to get there. This data set seems to say if there’s enough power in the value proposition and market fit, it overcomes issues of dilution, total capital required, time to market, and even early founder dilution.
Scott Phillips is CEO of the StarFish group of companies, including StarFish Medical and ViVitro Labs Inc. He holds a degree in engineering physics from the University of British Columbia. Under his leadership, StarFish has grown into a diverse professional organization with clients around the world and a 100 percent focus on medical devices. Scott is a Fellow of The Canadian Academy of Engineering, winner of the EY Entrepreneur Of The Year 2017 Pacific Awards Technology category, 2017 recipient of the VIATEC Technology Champion award, and chairman of the LifeSciences British Columbia board.
Looking at public markets can provide access to data. I found publicly available data on 24 medical device companies that had gone public (assembled by H. Lebret). As part of the listing process they disclosed details of all their prior funding events. Admittedly, there’s a selection bias with choosing startups that chose the public listing route, but the data is consistent and has been well scrutinized. Imperfections in data interpretation are my own (I’m an engineer after all), but I believe the conclusions hold true.
One story from the data is Cambridge Heart, founded based on research by Dr. Richard Cohen and an early cardiac electrophysiology innovator. MIT had spent a lot of money on securing patents for him and threatened to cut off IP funding unless he commercialized his inventions. He convinced MIT alumnus Jeffrey Arnold to be founding CEO and the company was born. Per publicly available information from the later IPO, Dr. Cohen received 1.25 million founders shares and a smaller number of options. A couple of other co-founders and MIT split another million shares.
In the A round of financing, 6.6 million shares were sold at $1 each, giving the company $6.6M to work with. (Interestingly, none of this came from venture capitalists.) When converted to commons they became 3.3 million common shares, so Dr. Cohen’s stake was down to 23 percent. In the B round two years later, another $3.5M was raised in exchange for 1.2M shares, after conversion. Before the company went public, he still owned 14.5 percent of the shares. In all, the company raised only $10.1M. The post IPO value was $167M—a ratio of almost 17x, which certainly helped overcome the equity dilution the founders had to take. Dr. Cohen’s stake was worth $17.7M. Other employees and directors shared $23.1M. It was a very successful outcome for the early visionaries and risk takers.
Intuitive Surgical, an innovator in robotic endoscopic surgery to allow minimally invasive procedures, is another interesting example. There were four co-founders: Frederic Moll, Robert Younge, John Freund, and the Stanford Research Institute. Similar to the Cambridge Heart case, they later hired another person, Lonnie Smith, as CEO.
Over three and a half years, the company completed four financing rounds. The first raised $5.4M on a $3.4M valuation—a 62 percent dilution event. They made incredibly efficient use of this capital. A year later they raised $30M at a $44M pre-money valuation for $5 per share. The share price had quintupled in that year. Later that year, they raised $17M at a $119M value for $8 per share. The next round took almost a year to complete and was at the same share price. They raised $41M at a $136M valuation in May 1999. The company did its IPO in June of 2000 at a $301 million post-money valuation. Their timing was miraculous, as the tech crash of 2000 was just around the corner. The founders’ value at exit was $30.4M. It seems the capital efficiency they exhibited with their first round had a dramatic effect in lowering their equity dilution and allowing them to create value.
The $300M IPO value was a relatively modest 3x more than the $93M raised in those four rounds. Today the company is valued at $70 billion, so it’s gone up over 200x in value from its IPO. Hopefully some of those investors held onto their shares.
In contrast, consider Inogen, an oxygen concentrator company that went public in 2013. The founders—Alison Bauerlein, Brenton Taylor, and Byron Myers—were students at UC Santa Barbara and won a business plan competition in 2001 for a new type of oxygen concentrator. They diluted 75 percent in their first round to raise $250,000. That’s what happens to students without a track record. From there, they did incredibly well, raising rounds of $5M, $6.6M, and $35.6M at increasing valuations. Then came two down rounds around the time of the 2008 crash. The second was at a lower share price than the original seed round.
Inogen was lucky to have survived; many companies weren’t so lucky. They brought in a hired gun CEO who received 2.5x as much equity as the founders. Together, they were successful in navigating equity raising and executed a successful IPO. Out of a $418M IPO value, the founders shared $4M. There was an option pool as well, so hopefully they got a piece of that. They built a company with almost 350 employees over 13 years. Today it’s valued at almost $1B.
The public data set had founder outcomes from $1M to $120M and time to IPO from four to 16 years. I had various hypotheses about what would lead to better founder outcomes. Time would be the entrepreneur’s enemy and longer stories would lead to worse outcomes. Minimizing A-round dilution would drive wealth creation. Large raises and many rounds would work against founder value. I tested the various theories.
Some broad observations can be made. About half got $20M or more between the founders (Chart 1) and the balance of the companies made far less for their founders. These companies made it to IPO and are often representative of a strong company with a big story. (Second Sight, with a founder exit of $120M, is a special case since Alfred Mann used a lot of his own money from previous successes to build it.)
Chart 1: Companies and the outcomes the founders achieved.
Time to exit was weakly correlated with founder outcome. Four of the strongest founder outcomes, (Cambridge Heart, Intuitive Surgical, Hansen Medical, and Biocartis) happened in less than eight years. The average of the rest was over 12 years. Five of the top 10 exits took over ten years. Unfortunately, there’s nothing fast about developing a medical device company to the point where it’s ready for a public listing.
My best hypothesis was on A-round dilution (Chart 2). I was confident a bunch of early dilution was bad. The data is not so clear. The top three founder exits all had A-round dilutions of 45 percent or lower, but the average of the rest was 59 percent—very close to the average of the rest of the top 10. There was no obvious pattern and correlation is weak; there were a lot of great exits with high early dilution.
Chart 2: A-round dilution.
The size of company varied from $30M to $3B and there was no strong correlation. Similarly, the total amount of investment was poorly correlated.
One value had a strong correlation: exit multiple, or the ratio of IPO value to total investment (Chart 3). It averaged over 16x for the top 10 and was under 4x for the rest. The data isn’t perfect; it doesn’t capture non-share transactions such as founder initial investment. Nonetheless, this correlation is too strong to ignore.
Chart 3: Ratio of IPO value to total investment.
I argue exit multiple is the most honest venture efficiency measure. In a simplistic way, it’s the ratio of the clinical value created vs. how expensive it was to get there. This data set seems to say if there’s enough power in the value proposition and market fit, it overcomes issues of dilution, total capital required, time to market, and even early founder dilution.
Scott Phillips is CEO of the StarFish group of companies, including StarFish Medical and ViVitro Labs Inc. He holds a degree in engineering physics from the University of British Columbia. Under his leadership, StarFish has grown into a diverse professional organization with clients around the world and a 100 percent focus on medical devices. Scott is a Fellow of The Canadian Academy of Engineering, winner of the EY Entrepreneur Of The Year 2017 Pacific Awards Technology category, 2017 recipient of the VIATEC Technology Champion award, and chairman of the LifeSciences British Columbia board.
