Alexander Naumov and Anastasia Lebedeva, Software Engineers, Auriga Inc.02.28.19
This article describes the special aspects of algorithm development for cardiac function defibrillation and its performance optimization with a next-generation microcontroller. In accordance with the project’s terms and conditions, the developed algorithm should fully comply with the requirements of the Russian National Standard GOST R IEC 60601-2-4-2013 for subsequent certification.
An automatic external defibrillator is a portable electronic device that detects cardiac abnormalities and, if necessary, produces an electrical discharge while concurrently displaying recommendations for further action. Early defibrillation is a key factor in successful cardiac resuscitation, which is why how precisely a defibrillator can define shockable rhythms (rhythms that are correctable through defibrillation) and how reliably it can work in the absence of such rhythms are critically important. These are key requirements while developing operation algorithms for such devices.
In cardiac rhythms recognition, there are two main approaches to working with a digital electrocardiogram (ECG): QRS-complex detection and the analysis of certain signal characteristics. Combining these approaches makes it possible to define with high precision not only shockable rhythms—namely ventricular fibrillation (VF/VFL) and ventricular tachycardia (VT)—but also rhythms for which defibrillation is contraindicated—normal sinus rhythms (N), asystole (ASYS), idioventricular rhythms (IVR), and atrial fibrillation (AFIB).
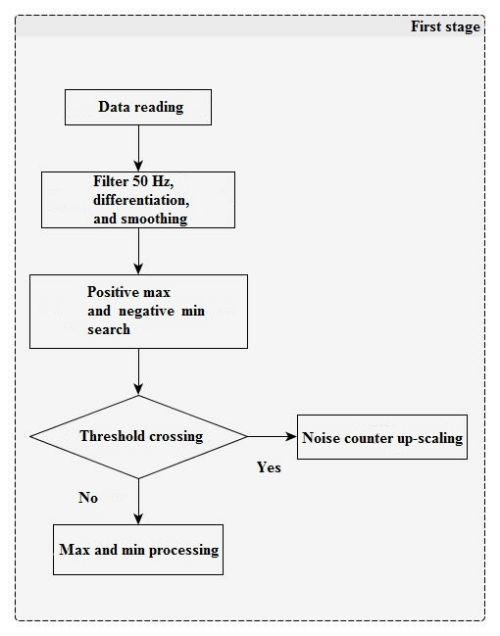
Figure 1
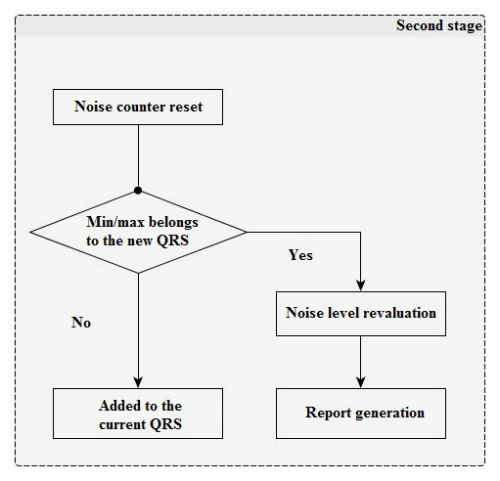
Figure 2
Following are the main approaches used for algorithm implementation.
QRS-Complex Detection Algorithm
This algorithm offers the possibility of detecting ventricular contraction (QRS-complex) based on ECG signal and was used at a later stage when developing contraindications to defibrillation identification methods (AFIB, IVR, etc.).
In the first stage (Figure 1), there is a filter for power-line disturbance suppression (50/60 Hz). After that, negative lower limits (minimum) and positive maximum peaks are searched for signal derivatives with a window of 13 counts. Derivative impulses and lesser threshold values (with separate positive and negative) are added to integrators and noise counters, the ratio of which will further provide the noise level between the two QRS-complexes.
In the second stage (Figure 2), impulses that exceed the threshold values are analyzed and added to the current QRS-complex impulse set. Any juxtaposed unipolar pulses are merged.
After that, verification is performed; if the number of permissible pulses in the QRS-complex or its limit width have been exceeded, then its properties are saved into a report, the current positive and negative thresholds are recalculated for the pulse amount (with due regard to the old value, current QRS-complex height, and the current noise level), and counters and noise integrators are reset.
This QRS-complex detection algorithm sensitivity on an open database MITDB is 93.38 percent, which proves its efficacy.
VF/VFL, VT, and ASYS Detection Algorithm
This algorithm permits making a decision about defibrillation necessity based on ECG if the following arrhythmias are present: ventricular fibrillation (VF), ventricular flutter (VFL), and ventricular tachycardia (VT). The algorithm’s main concept is centered on certain frequency analysis (13–16.5 Hz) for the ECG signal. Analysis includes a counter estimation for the time interval, on which basis the decision about defibrillation necessity is taken. The counter is scaled up if a sample falls within a particular range of values. This range of values was found by means of a statistical analysis of the counter value distribution among big data selections.
Decision-making takes place for each time interval Т, as a result of which the cardiac rhythm was classified as follows:
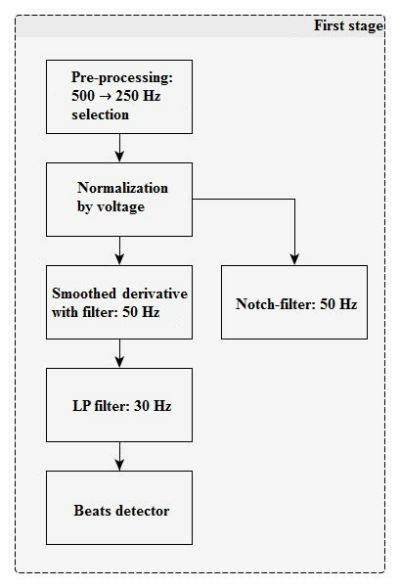
Figure 3
At the first stage (Figure 3), the algorithm includes input signal pre-processing and filtering.
Filter parameters
LP: 30 Hz filter
Direct Form II digital filter with an SOS matrix: [b0 b1 b2 1 a1 a2]
w[n] = x[n] - a1*w[n-1] – a2*w[n-2]
y[n] = b0*w[n] + b1*w[n-1] + b2*w[n-2]
SOS matrix
{{32, 64, 32, 33, -31, 11}, 47, 5, 9, 0, 0}
After applying a smoothed derivate filter, the signal is also used by beats detector (QRS-complexes) for further rhythm analysis.
At the second stage (Figure 4), a band-pass filter is applied and the main classification parameters are calculated.
Filter parameters
The 13–16.5 Hz band-pass filter is a recursive band filter with central frequency 14.6 Hz and bandwidth range 13–16.5 Hz (at the -3dB level).
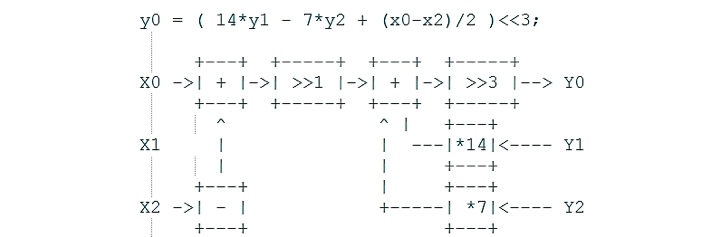
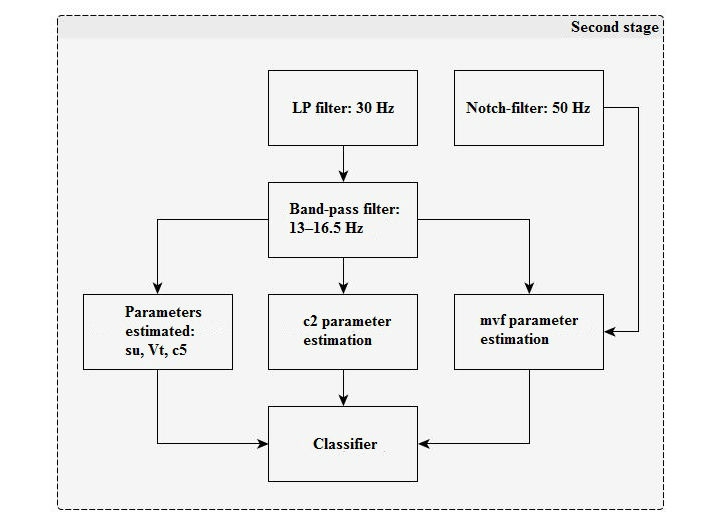
Figure 4
Classification parameters description
c2: Processed data samples counter for the number with higher than average signal value for 0.8 s. The average interval is 6.4 s.
c5: The fourth root of the processed data samples modulus sum for 6.4 s.
su: Signal similarity estimation with 1/2 period offset for 0.8 s. This is averaged over a 6.4 s interval.
vT: Period estimation by the ratio of signal modulus sum after the LowPass filter to signal derivate modulus sum after the Notch filter. This is summed for 6.4 s.
mvf: The ratio of average signal modulus after the LowPass filter to signal modulus maximum after the Notch filter (for 6.4 s).
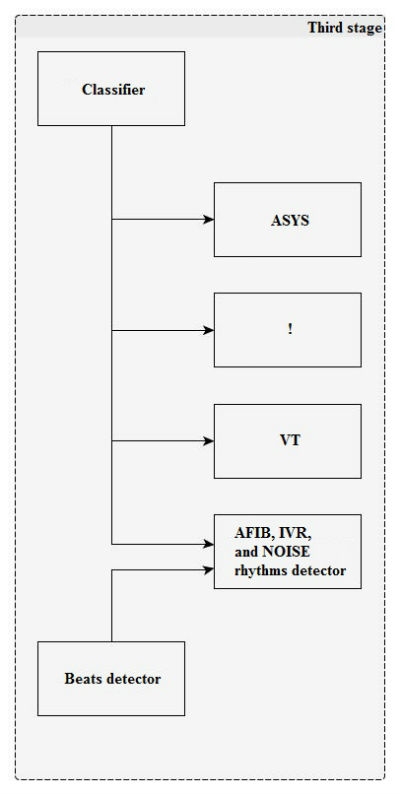
Figure 5
At the third stage (Figure 5), the rhythm is classified by the boundary attributes.
The rhythm is classified every 6.4 s.
The algorithm test results on the MIXDB database (open-source data merged with customer-provided data):
VF
Sensitivity: 96.04%
Specificity: 99.40%
VT
Sensitivity: 80.51%
Specificity: 99.77%
ASYS
Sensitivity: 95.83%
Specificity: 99.98%
Where sensitivity = detection sensitivity = the correct identification of a certain cardiac rhythm; specificity = detection specificity = absence of cardiac rhythm false detection
AFIB Detection Algorithm
An algorithm based on the ventricular cardiac activity analysis of ECG allows the detection of atrial fibrillation occurrence, which is a contraindication to defibrillation, by means of estimating the ratio of m size pattern hits to m+1 points (for this algorithm m = 1). In other words, heart-rate discontinuity and changeability are typical in atrial fibrillation. Coincidence probability assessment of two successively taken RR-interval readings with two other successively taken readings on the assumption that one reading taken separately would also coincide with some other readings for a segment under analysis, allows the discovery of this type of contraindication.
The algorithm can be divided into several stages for our purposes.
The first stage is for sample collection. Detected beats samples are collected (R-peaks coordinates), until their total number N reaches a certain value for which a segment for analysis can be considered complete. For the original algorithm, the minimum possible N is taken as 12. The current implementation also uses 12-beat segments. At that, the data for further analysis and processing is a selection of the interval lengths between two adjoining rrDist beats.
In the second stage, we analyze the coincidence number of two successively taken intervals with any two remaining successively taken data (А) and the coincidence number for one reading with remaining data on the segment (B) within the rTolerance confidence interval.

Coincidence fulfills the condition that for any corresponding element of two patterns x(i) and x(j) being compared
Consequently, for Ai this condition results in an amplitude difference in the confidence interval for both taken elements:
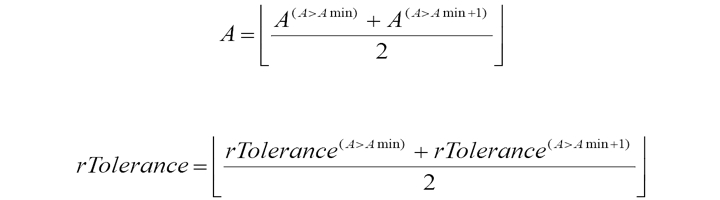
To improve the algorithm’s performance accuracy and achieve the minimum coincidence number value for the two readings for each segment Amin, the rTolerance confidence interval width is updated adaptively. The initial value of the rTolerance confidence interval width for each segment of N beats selected from the MIT-BIH Atrial Fibrillation Database (AFDB), is equivalent to four readings, with increasing step size of one reading. The process lasts until the coincidence number for two readings reaches or exceeds the minimum allowed value of Amin =6. The counterpart А and current value of rTolerance are saved and the rTolerance iteration procedures are repeated until the condition is fulfilled for A ≥ (Amin + 1). The originally saved A and rTolerance are averaged with reported values:
The Third stage involves calculating the reported value ratio if patterns A and B coincide. For a more precise estimation of fibrillation detection and the reduction of natural fluctuations for intervals width values, a normalizing coefficient is introduced that can also compensate for heart-rate influence and sampling frequency; its modulus is denoted by threshold value AFIB:

In the final phase rate, the defined value is compared with the threshold value AFIB = 570. Exceeding this threshold means that atrial fibrillation exists throughout the analyzed interval. The beginning-of-fibrillation interval marker is calculated as the first beat position from the segment cumulated on the first step. The end mark of the fibrillation interval coincides with the target rhythm change.
The algorithm test results on a MIXDB database (open-source data merged with customer-provided data):
Sensitivity: 83.45%
Specificity: 93.40%
IVR Detection Algorithm
This algorithm permits the detection of idioventricular rhythm (IVR) occurrence based on the ECG signal.
The basis for this algorithm is the analysis of the QRS-complex width and RR-intervals obtained with the help of the existing QRS-detector.
At the first stage, each RR-interval width is estimated and marked as follows:
The following rules are applied:
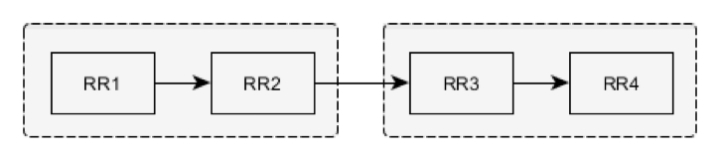
Four successive RR intervals are compared. RR1–RR2 and RR3–RR4 pairs are checked separately against intervals similarity tests. If no RR-interval (for example, RR1 and RR2) included in the pair (RR1–RR2) exceeds the limits for both intervals’ average by more than 12.5 percent, then all four intervals are marked NN.
If this condition is not fulfilled, the interval is marked with the help of interval-pairs estimation (the previous estimated interval and the interval in question): RR1 and RR2.

The beat corresponding to the RR2 interval is considered to be ventricular following the normal beat and is marked as NV if the following conditions are fulfilled:
The beat corresponding to the RR2 interval is considered ventricular following a ventricular beat and is marked as VV if the following conditions are fulfilled:
The beat corresponding to the RR2 interval is considered normal following the ventricular beat and is marked VN if the following conditions are fulfilled:
NN and VN are considered NORMAL intervals, NV and VV are PVC.
The second stage of the algorithm execution uses the heart-rate value obtained from the RR-interval width coupled with information about the QRS-complex width for this interval. The heart rate is calculated using the following formula:

where BPM is heart rate (beats per minute) and HFreq is the discretization frequency.
Each beat is marked IVR if it meets the heart-rate condition and QRS-complex width threshold-exceeding condition:

where QRSwidth(s) is the QRS-complex width (s), QRSwidthnorm is the QRS-complex normal half-width (ms), and HFreq is the discretization frequency (Hz).
Algorithm test results on the MIXDB database (open source data merged with customer-provided data):
Sensitivity: 75.00%
Specificity: 89.90%
Conclusion
The developed algorithm for digital data analysis allows for high rates of shockable rhythm detection, which exceeds the threshold established by the Russian National Standard GOST R IEC 60601-2-4-2013 by 6 percent for ventricular fibrillation rhythms and by 5 percent for ventricular tachycardia. Method specificity (99 percent) offers the opportunity to detect unshockable rhythms to a high degree of accuracy and implemented additional treatment that permits the identification of current rhythm type when defibrillation is counter-indicative, such as for asystole, normal sinus rhythm, idioventricular rhythm, or atrial fibrillation. Therefore, this algorithm can be successfully used for both defibrillation and for medical systems that require continuous patient cardiac rhythm monitoring.
An automatic external defibrillator is a portable electronic device that detects cardiac abnormalities and, if necessary, produces an electrical discharge while concurrently displaying recommendations for further action. Early defibrillation is a key factor in successful cardiac resuscitation, which is why how precisely a defibrillator can define shockable rhythms (rhythms that are correctable through defibrillation) and how reliably it can work in the absence of such rhythms are critically important. These are key requirements while developing operation algorithms for such devices.
In cardiac rhythms recognition, there are two main approaches to working with a digital electrocardiogram (ECG): QRS-complex detection and the analysis of certain signal characteristics. Combining these approaches makes it possible to define with high precision not only shockable rhythms—namely ventricular fibrillation (VF/VFL) and ventricular tachycardia (VT)—but also rhythms for which defibrillation is contraindicated—normal sinus rhythms (N), asystole (ASYS), idioventricular rhythms (IVR), and atrial fibrillation (AFIB).
Figure 1
Figure 2
QRS-Complex Detection Algorithm
This algorithm offers the possibility of detecting ventricular contraction (QRS-complex) based on ECG signal and was used at a later stage when developing contraindications to defibrillation identification methods (AFIB, IVR, etc.).
In the first stage (Figure 1), there is a filter for power-line disturbance suppression (50/60 Hz). After that, negative lower limits (minimum) and positive maximum peaks are searched for signal derivatives with a window of 13 counts. Derivative impulses and lesser threshold values (with separate positive and negative) are added to integrators and noise counters, the ratio of which will further provide the noise level between the two QRS-complexes.
In the second stage (Figure 2), impulses that exceed the threshold values are analyzed and added to the current QRS-complex impulse set. Any juxtaposed unipolar pulses are merged.
After that, verification is performed; if the number of permissible pulses in the QRS-complex or its limit width have been exceeded, then its properties are saved into a report, the current positive and negative thresholds are recalculated for the pulse amount (with due regard to the old value, current QRS-complex height, and the current noise level), and counters and noise integrators are reset.
This QRS-complex detection algorithm sensitivity on an open database MITDB is 93.38 percent, which proves its efficacy.
VF/VFL, VT, and ASYS Detection Algorithm
This algorithm permits making a decision about defibrillation necessity based on ECG if the following arrhythmias are present: ventricular fibrillation (VF), ventricular flutter (VFL), and ventricular tachycardia (VT). The algorithm’s main concept is centered on certain frequency analysis (13–16.5 Hz) for the ECG signal. Analysis includes a counter estimation for the time interval, on which basis the decision about defibrillation necessity is taken. The counter is scaled up if a sample falls within a particular range of values. This range of values was found by means of a statistical analysis of the counter value distribution among big data selections.
Decision-making takes place for each time interval Т, as a result of which the cardiac rhythm was classified as follows:
- Shockable rhythm (!) – Cardiac rhythm; is subjected to defibrillation
- Ventricular tachycardia (VT) – Cardiac rhythm; is not subjected to defibrillation
- Other rhythms (N) – Other cardiac rhythms that are not subjected to defibrillation
Figure 3
Filter parameters
LP: 30 Hz filter
Direct Form II digital filter with an SOS matrix: [b0 b1 b2 1 a1 a2]
w[n] = x[n] - a1*w[n-1] – a2*w[n-2]
y[n] = b0*w[n] + b1*w[n-1] + b2*w[n-2]
SOS matrix
{{32, 64, 32, 33, -31, 11}, 47, 5, 9, 0, 0}
After applying a smoothed derivate filter, the signal is also used by beats detector (QRS-complexes) for further rhythm analysis.
At the second stage (Figure 4), a band-pass filter is applied and the main classification parameters are calculated.
Filter parameters
The 13–16.5 Hz band-pass filter is a recursive band filter with central frequency 14.6 Hz and bandwidth range 13–16.5 Hz (at the -3dB level).
Figure 4
Classification parameters description
c2: Processed data samples counter for the number with higher than average signal value for 0.8 s. The average interval is 6.4 s.
c5: The fourth root of the processed data samples modulus sum for 6.4 s.
su: Signal similarity estimation with 1/2 period offset for 0.8 s. This is averaged over a 6.4 s interval.
vT: Period estimation by the ratio of signal modulus sum after the LowPass filter to signal derivate modulus sum after the Notch filter. This is summed for 6.4 s.
mvf: The ratio of average signal modulus after the LowPass filter to signal modulus maximum after the Notch filter (for 6.4 s).
Figure 5
The rhythm is classified every 6.4 s.
The algorithm test results on the MIXDB database (open-source data merged with customer-provided data):
VF
Sensitivity: 96.04%
Specificity: 99.40%
VT
Sensitivity: 80.51%
Specificity: 99.77%
ASYS
Sensitivity: 95.83%
Specificity: 99.98%
Where sensitivity = detection sensitivity = the correct identification of a certain cardiac rhythm; specificity = detection specificity = absence of cardiac rhythm false detection
AFIB Detection Algorithm
An algorithm based on the ventricular cardiac activity analysis of ECG allows the detection of atrial fibrillation occurrence, which is a contraindication to defibrillation, by means of estimating the ratio of m size pattern hits to m+1 points (for this algorithm m = 1). In other words, heart-rate discontinuity and changeability are typical in atrial fibrillation. Coincidence probability assessment of two successively taken RR-interval readings with two other successively taken readings on the assumption that one reading taken separately would also coincide with some other readings for a segment under analysis, allows the discovery of this type of contraindication.
The algorithm can be divided into several stages for our purposes.
The first stage is for sample collection. Detected beats samples are collected (R-peaks coordinates), until their total number N reaches a certain value for which a segment for analysis can be considered complete. For the original algorithm, the minimum possible N is taken as 12. The current implementation also uses 12-beat segments. At that, the data for further analysis and processing is a selection of the interval lengths between two adjoining rrDist beats.
In the second stage, we analyze the coincidence number of two successively taken intervals with any two remaining successively taken data (А) and the coincidence number for one reading with remaining data on the segment (B) within the rTolerance confidence interval.
Coincidence fulfills the condition that for any corresponding element of two patterns x(i) and x(j) being compared
|xi – xj|< rTolerance.
Consequently, for Ai this condition results in an amplitude difference in the confidence interval for both taken elements:
(|xi – xj|< rTolerance) &&(|xi+1 – xj+1|< rTolerance)
To improve the algorithm’s performance accuracy and achieve the minimum coincidence number value for the two readings for each segment Amin, the rTolerance confidence interval width is updated adaptively. The initial value of the rTolerance confidence interval width for each segment of N beats selected from the MIT-BIH Atrial Fibrillation Database (AFDB), is equivalent to four readings, with increasing step size of one reading. The process lasts until the coincidence number for two readings reaches or exceeds the minimum allowed value of Amin =6. The counterpart А and current value of rTolerance are saved and the rTolerance iteration procedures are repeated until the condition is fulfilled for A ≥ (Amin + 1). The originally saved A and rTolerance are averaged with reported values:
The Third stage involves calculating the reported value ratio if patterns A and B coincide. For a more precise estimation of fibrillation detection and the reduction of natural fluctuations for intervals width values, a normalizing coefficient is introduced that can also compensate for heart-rate influence and sampling frequency; its modulus is denoted by threshold value AFIB:
In the final phase rate, the defined value is compared with the threshold value AFIB = 570. Exceeding this threshold means that atrial fibrillation exists throughout the analyzed interval. The beginning-of-fibrillation interval marker is calculated as the first beat position from the segment cumulated on the first step. The end mark of the fibrillation interval coincides with the target rhythm change.
The algorithm test results on a MIXDB database (open-source data merged with customer-provided data):
Sensitivity: 83.45%
Specificity: 93.40%
IVR Detection Algorithm
This algorithm permits the detection of idioventricular rhythm (IVR) occurrence based on the ECG signal.
The basis for this algorithm is the analysis of the QRS-complex width and RR-intervals obtained with the help of the existing QRS-detector.
At the first stage, each RR-interval width is estimated and marked as follows:
- NN: normal beats following normal beats
- NV: ventricular beats following normal beats
- VV: ventricular beats following ventricular beats
- VN: normal beats following ventricular beats
The following rules are applied:
NN:
Four successive RR intervals are compared. RR1–RR2 and RR3–RR4 pairs are checked separately against intervals similarity tests. If no RR-interval (for example, RR1 and RR2) included in the pair (RR1–RR2) exceeds the limits for both intervals’ average by more than 12.5 percent, then all four intervals are marked NN.
If this condition is not fulfilled, the interval is marked with the help of interval-pairs estimation (the previous estimated interval and the interval in question): RR1 and RR2.
NV:
The beat corresponding to the RR2 interval is considered to be ventricular following the normal beat and is marked as NV if the following conditions are fulfilled:
- The RR1 interval (previous interval) is marked NN
- The RR2 interval value does not exceed 75 percent of RR1
VV:
The beat corresponding to the RR2 interval is considered ventricular following a ventricular beat and is marked as VV if the following conditions are fulfilled:
- The RR1 interval is marked NV or VV
- Neither the RR1 or RR2 intervals exceed the limits for both intervals average by more than 12.5 percent
VN:
The beat corresponding to the RR2 interval is considered normal following the ventricular beat and is marked VN if the following conditions are fulfilled:
- The RR1 interval (previous interval) is marked NV or VV
- The RR2 interval value exceeds the previous interval value by more than 25 percent
NN and VN are considered NORMAL intervals, NV and VV are PVC.
The second stage of the algorithm execution uses the heart-rate value obtained from the RR-interval width coupled with information about the QRS-complex width for this interval. The heart rate is calculated using the following formula:
where BPM is heart rate (beats per minute) and HFreq is the discretization frequency.
Each beat is marked IVR if it meets the heart-rate condition and QRS-complex width threshold-exceeding condition:
where QRSwidth(s) is the QRS-complex width (s), QRSwidthnorm is the QRS-complex normal half-width (ms), and HFreq is the discretization frequency (Hz).
Algorithm test results on the MIXDB database (open source data merged with customer-provided data):
Sensitivity: 75.00%
Specificity: 89.90%
Conclusion
The developed algorithm for digital data analysis allows for high rates of shockable rhythm detection, which exceeds the threshold established by the Russian National Standard GOST R IEC 60601-2-4-2013 by 6 percent for ventricular fibrillation rhythms and by 5 percent for ventricular tachycardia. Method specificity (99 percent) offers the opportunity to detect unshockable rhythms to a high degree of accuracy and implemented additional treatment that permits the identification of current rhythm type when defibrillation is counter-indicative, such as for asystole, normal sinus rhythm, idioventricular rhythm, or atrial fibrillation. Therefore, this algorithm can be successfully used for both defibrillation and for medical systems that require continuous patient cardiac rhythm monitoring.